Data-handling worksheet for Class 7, including mean, median, mode, range, and pie charts. Includes solved examples and challenging problems to help your child analyse and interpret data at an advanced level.
At Class 7, Data Handling becomes analytical. We move from simply reading and displaying data to calculating statistical measures and drawing conclusions from them. The focus shifts to understanding what data tells us — not just what it shows. We work with mean, median, mode, and range to summarise data sets, interpret double bar graphs, and calculate angles for pie charts.
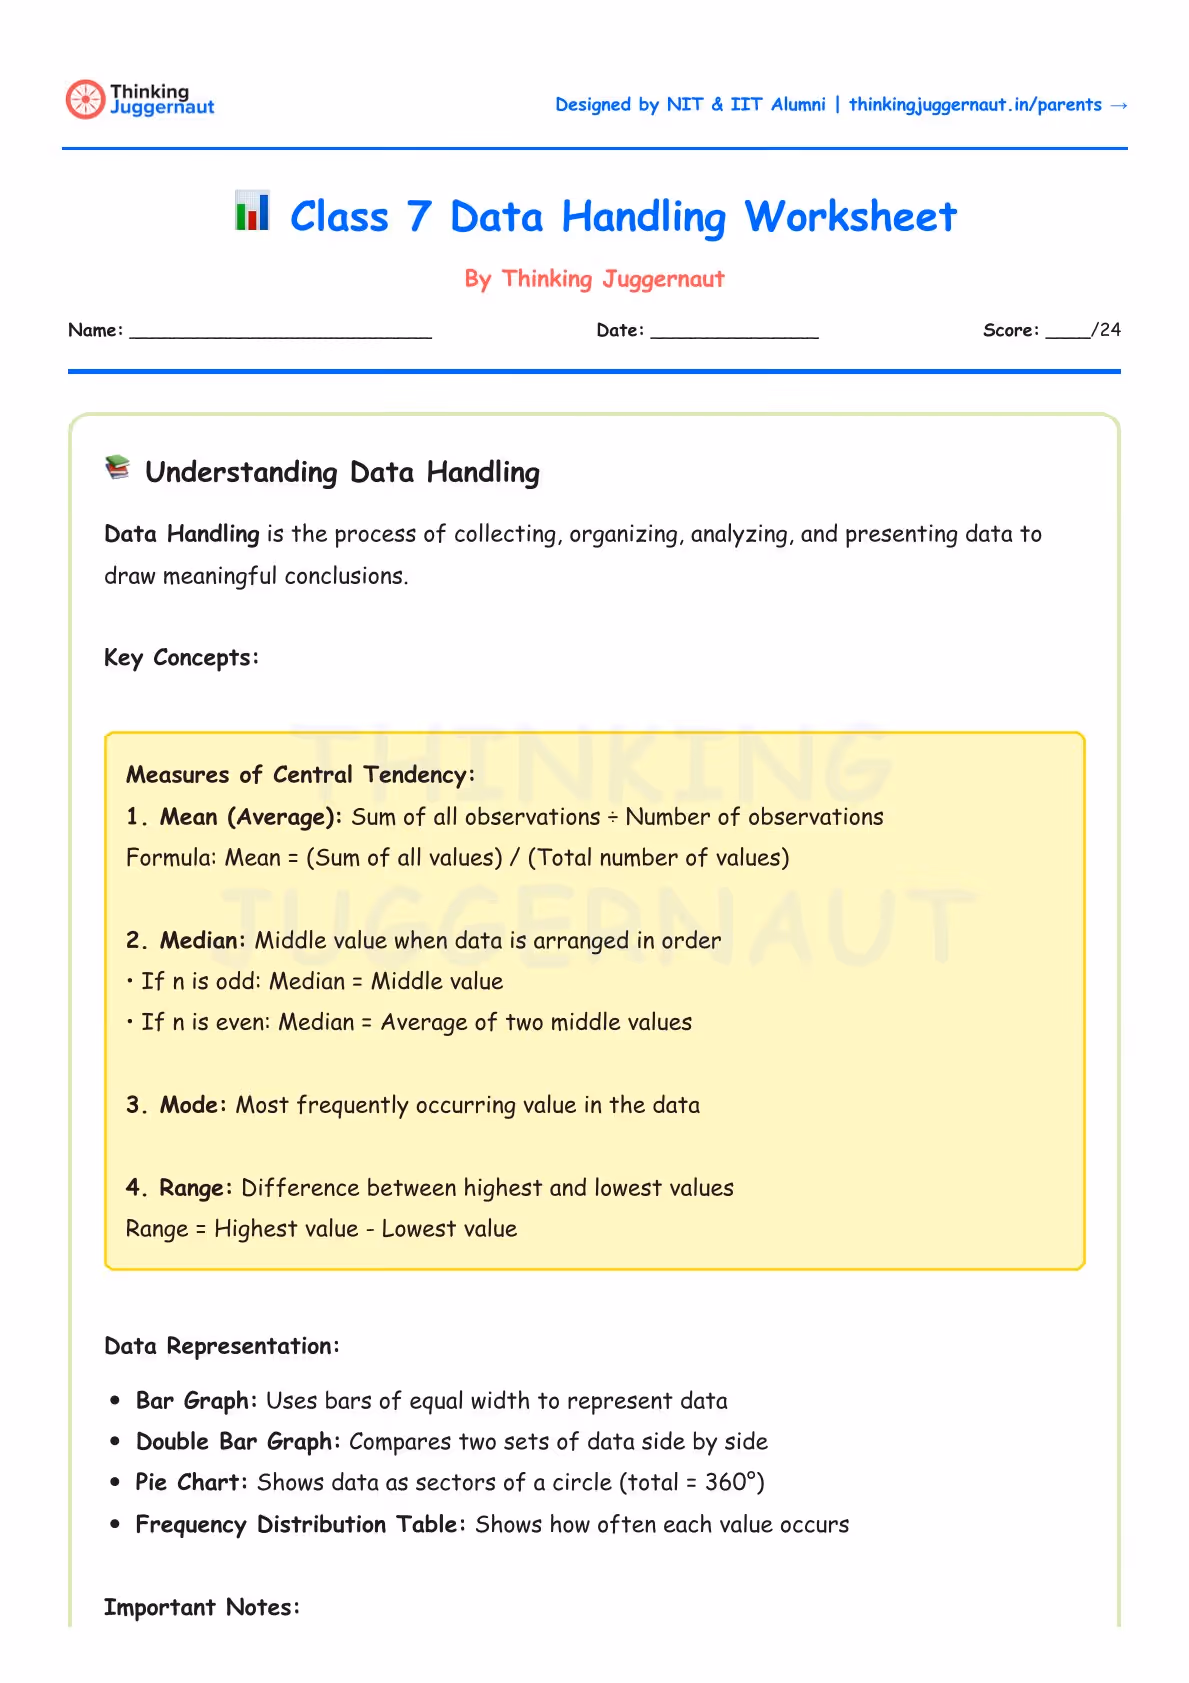
Mean (Average): Found by adding all values and dividing by the number of values. It gives us a single number that represents the entire data set, but it can be pulled up or down by extreme values.
Median: The middle value when data is arranged in ascending order. If there is an even number of values, the median is the average of the two middle values. Unlike the mean, it is not affected by extreme values.
Mode: The value that appears most frequently. A data set can have no mode, one mode, or multiple modes.
Range: The difference between the highest and lowest values. It tells us how spread out the data is.
Pie Charts: A circle divided into sectors where each sector represents a category. The angle for each sector is calculated using the formula: Angle = (Value ÷ Total) × 360°.
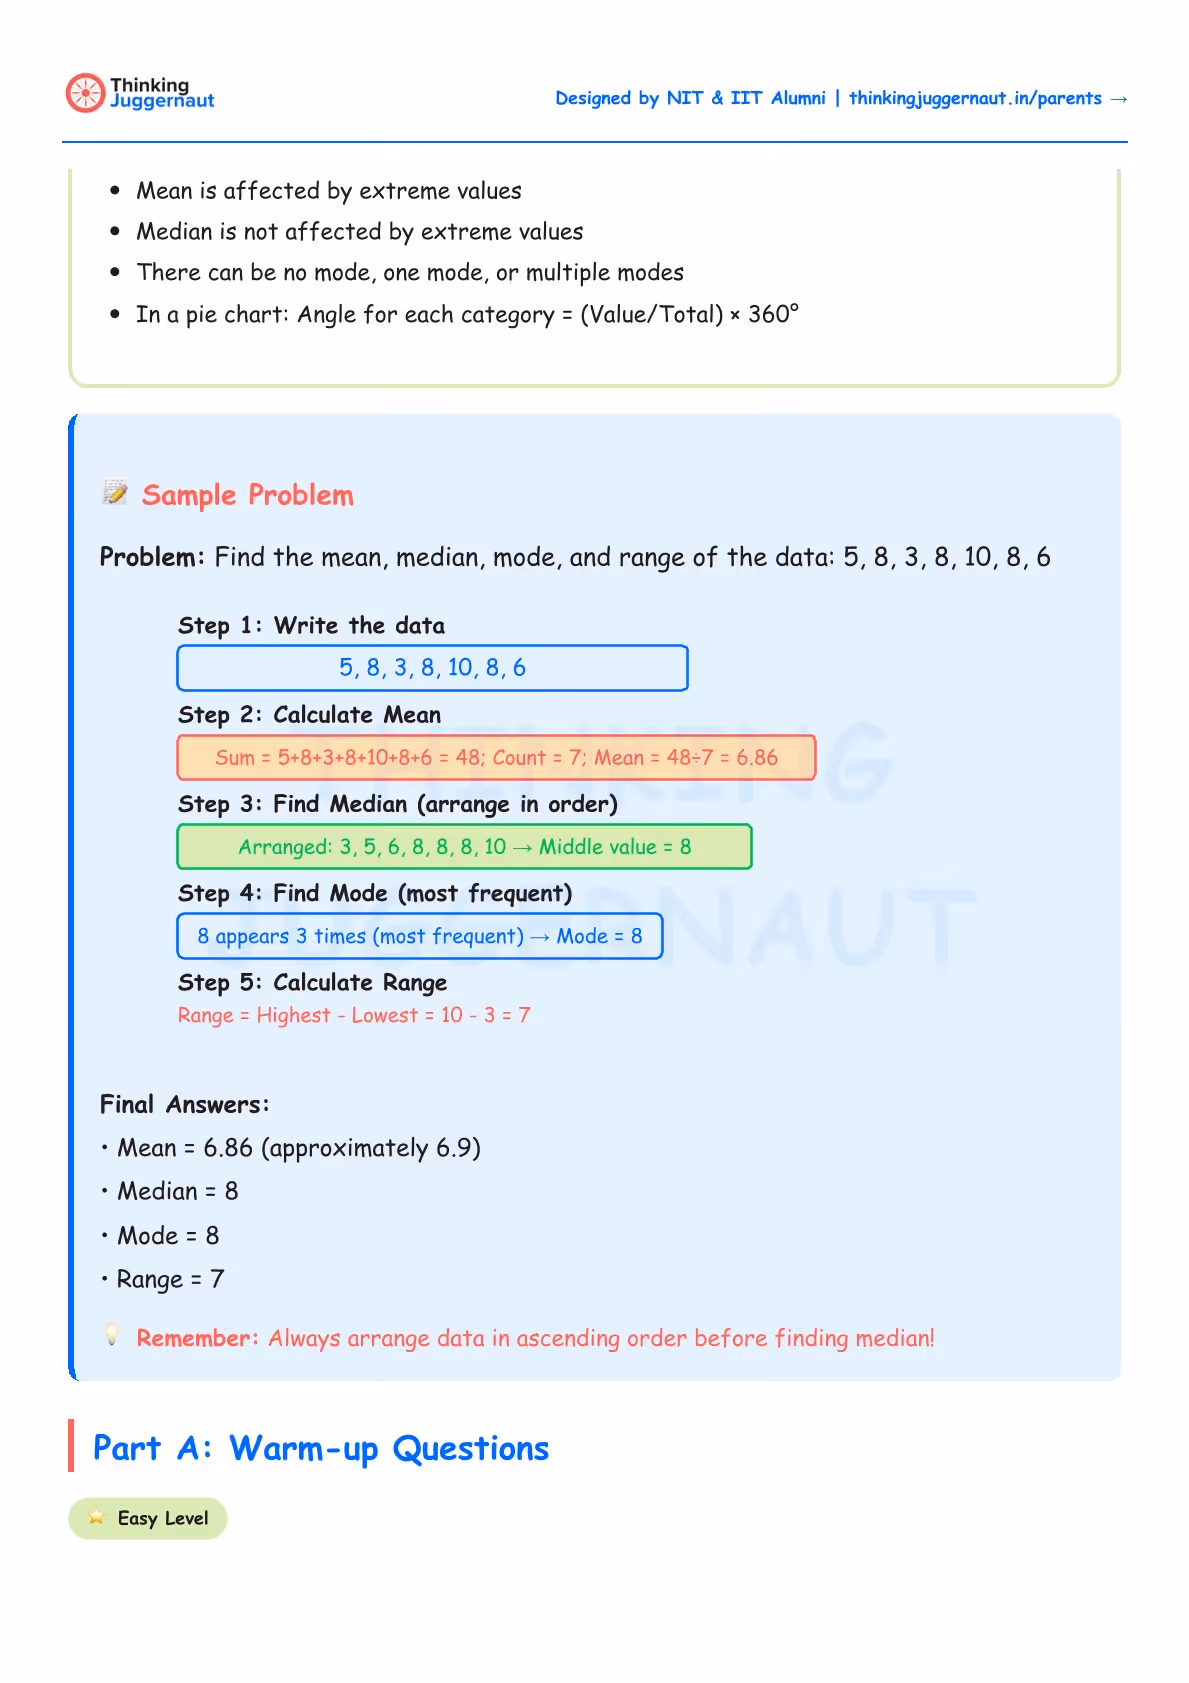
Find the mean, median, mode, and range of: 5, 8, 3, 8, 10, 8, 6.
First, calculate the mean. Add all values: 5 + 8 + 3 + 8 + 10 + 8 + 6 = 48. Divide by the count: 48 ÷ 7 = 6.86.
Next, find the median. Arrange in ascending order: 3, 5, 6, 8, 8, 8, 10. There are 7 values (odd), so the median is the 4th value, which is 8.
Then, find the mode. The value 8 appears 3 times, more than any other. The mode is 8.
Finally, calculate the range. Highest value minus lowest value: 10 − 3 = 7.
Always arrange data in ascending order before finding the median. Skipping this step is the most common error and leads to a wrong answer every time.
Do not confuse mean and median. The mean requires addition and division. The median requires sorting and finding the middle value. They are different measures and often give different results.
When finding the mean, divide by the total count of values, not by any other number. Forgetting to divide, or dividing by the wrong count, is a frequent calculation mistake.
For pie charts, remember that all angles must add up to 360°. Use this as a check after calculating each sector.
When a problem gives you the mean or median and asks you to find a missing value, work backwards. Calculate the total first using the formula, then subtract the known values.
Read bar graph scales carefully before extracting any values. A misread scale will make every subsequent calculation wrong.
Worksheets build practice. The Applied Maths Project Kit builds understanding — 30 real-world math activities covering the same concepts your child is practising here, from multiplication and grouping to measurement and data.

Designed by IIT & NIT Alumni · NEP-2020 aligned · Trusted by parents across India
Class 7 Algebra
Class 7 Algebraic Expressions
Class 7 Data Handling
Class 7 Fractions and Decimals
Class 7 Geometric Twins
Class 7 Geometry
Class 7 Integers
Class 7 Ratio and Proportion
Not in Class 7?
Visit our Main Math Worksheet Hub to explore all printable worksheets from Class 2 to Class 8.
Almost there!
We will confirm your order on WhatsApp
Order placed!
Thank you! You will receive a WhatsApp confirmation shortly.