⭐ Answer Key included!
Data handling worksheet for Class 4 with tally marks, pictographs, and tables. Includes solved examples and practice questions to help your child collect, organise, and present data clearly.
Data means information or numbers that we collect about the world around us. Data Handling is the process of organising this information so it becomes easy to count, compare, and understand.
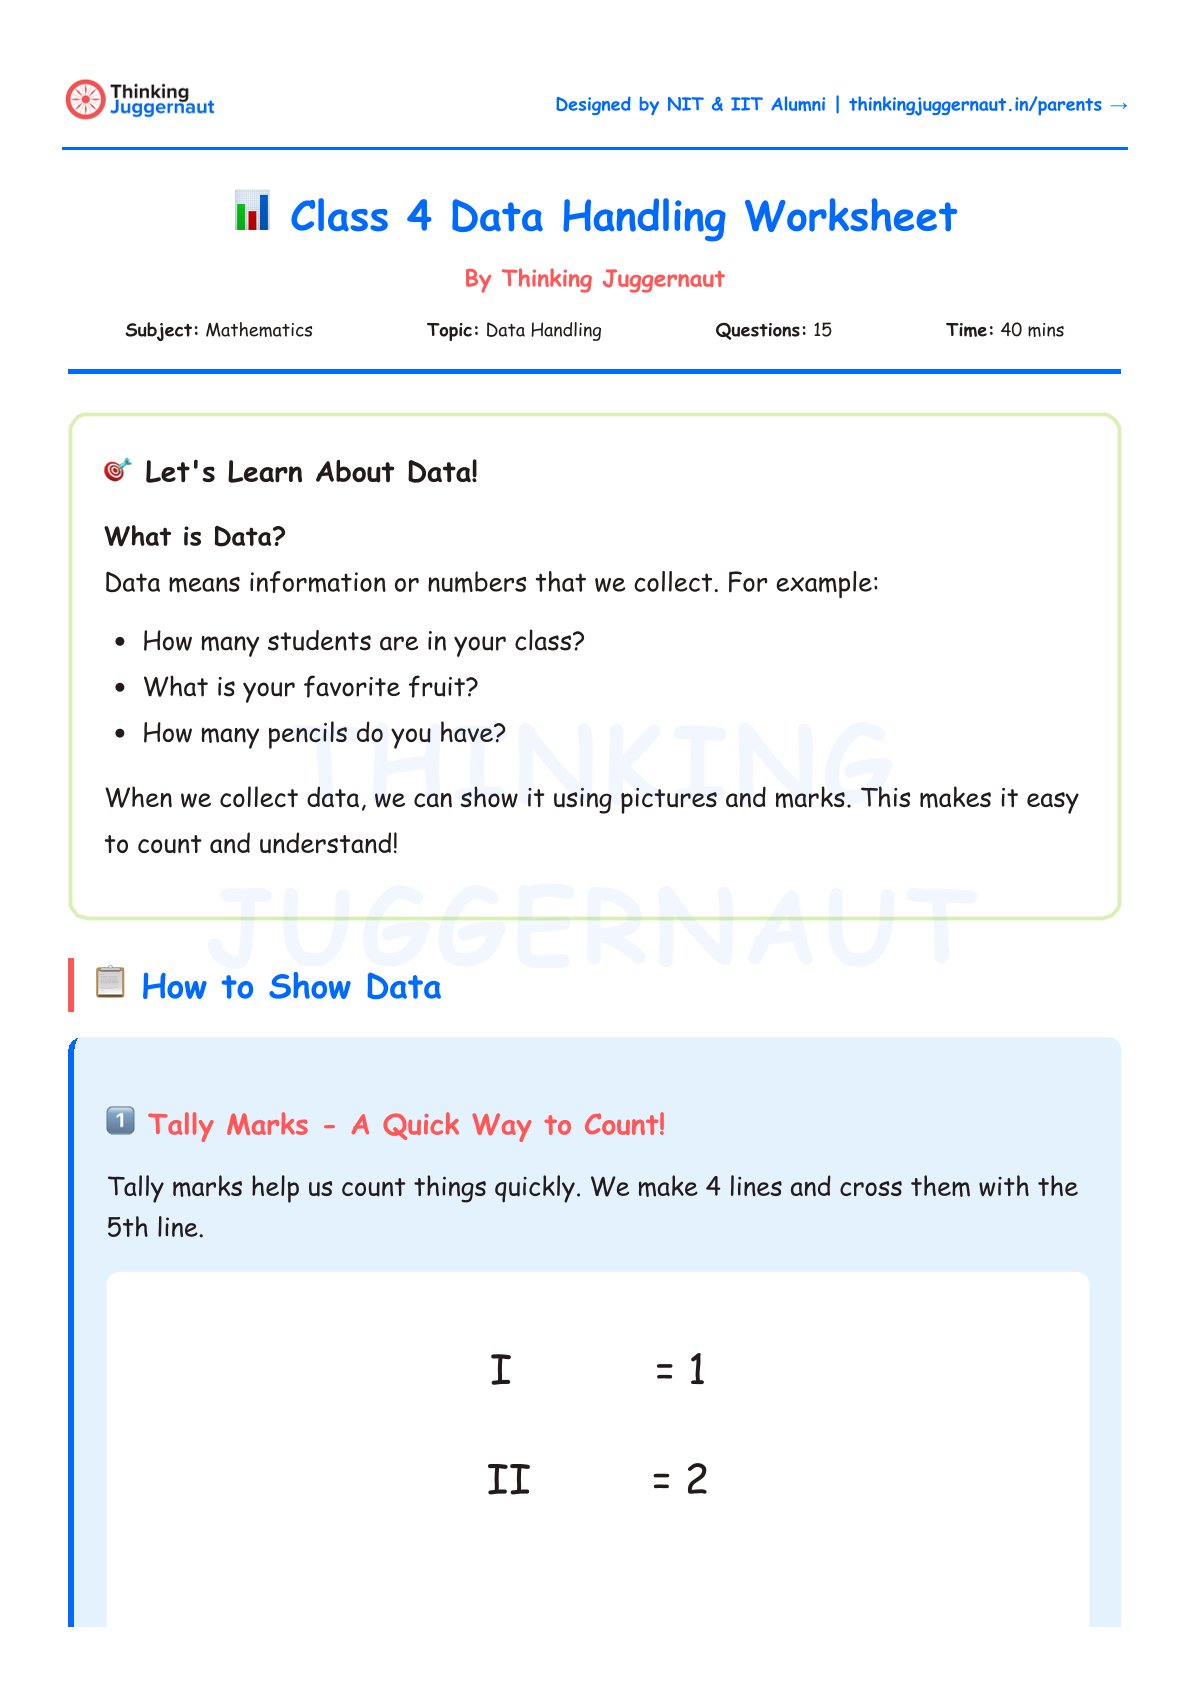
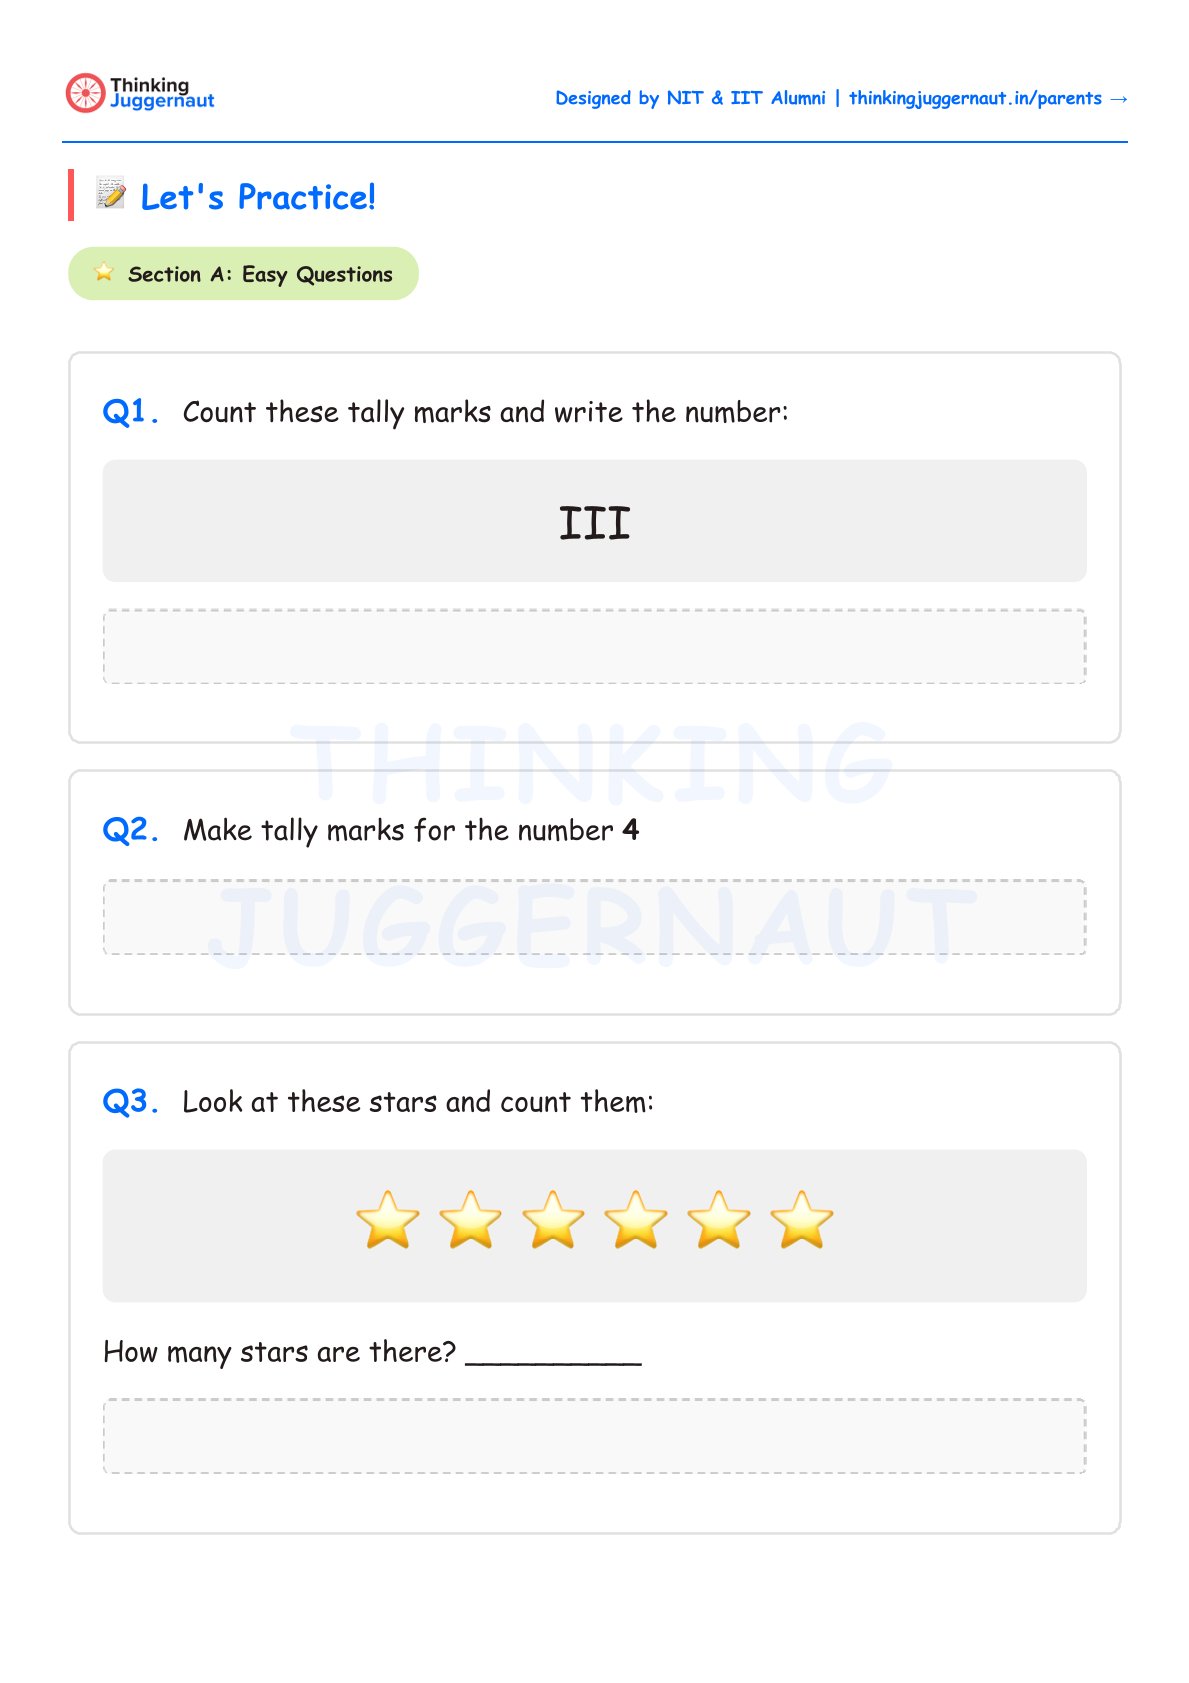
Tally Marks: A quick way to count things. We draw 4 vertical lines and cross them with a 5th diagonal line to make a group of 5. This makes counting large numbers faster and less error-prone.
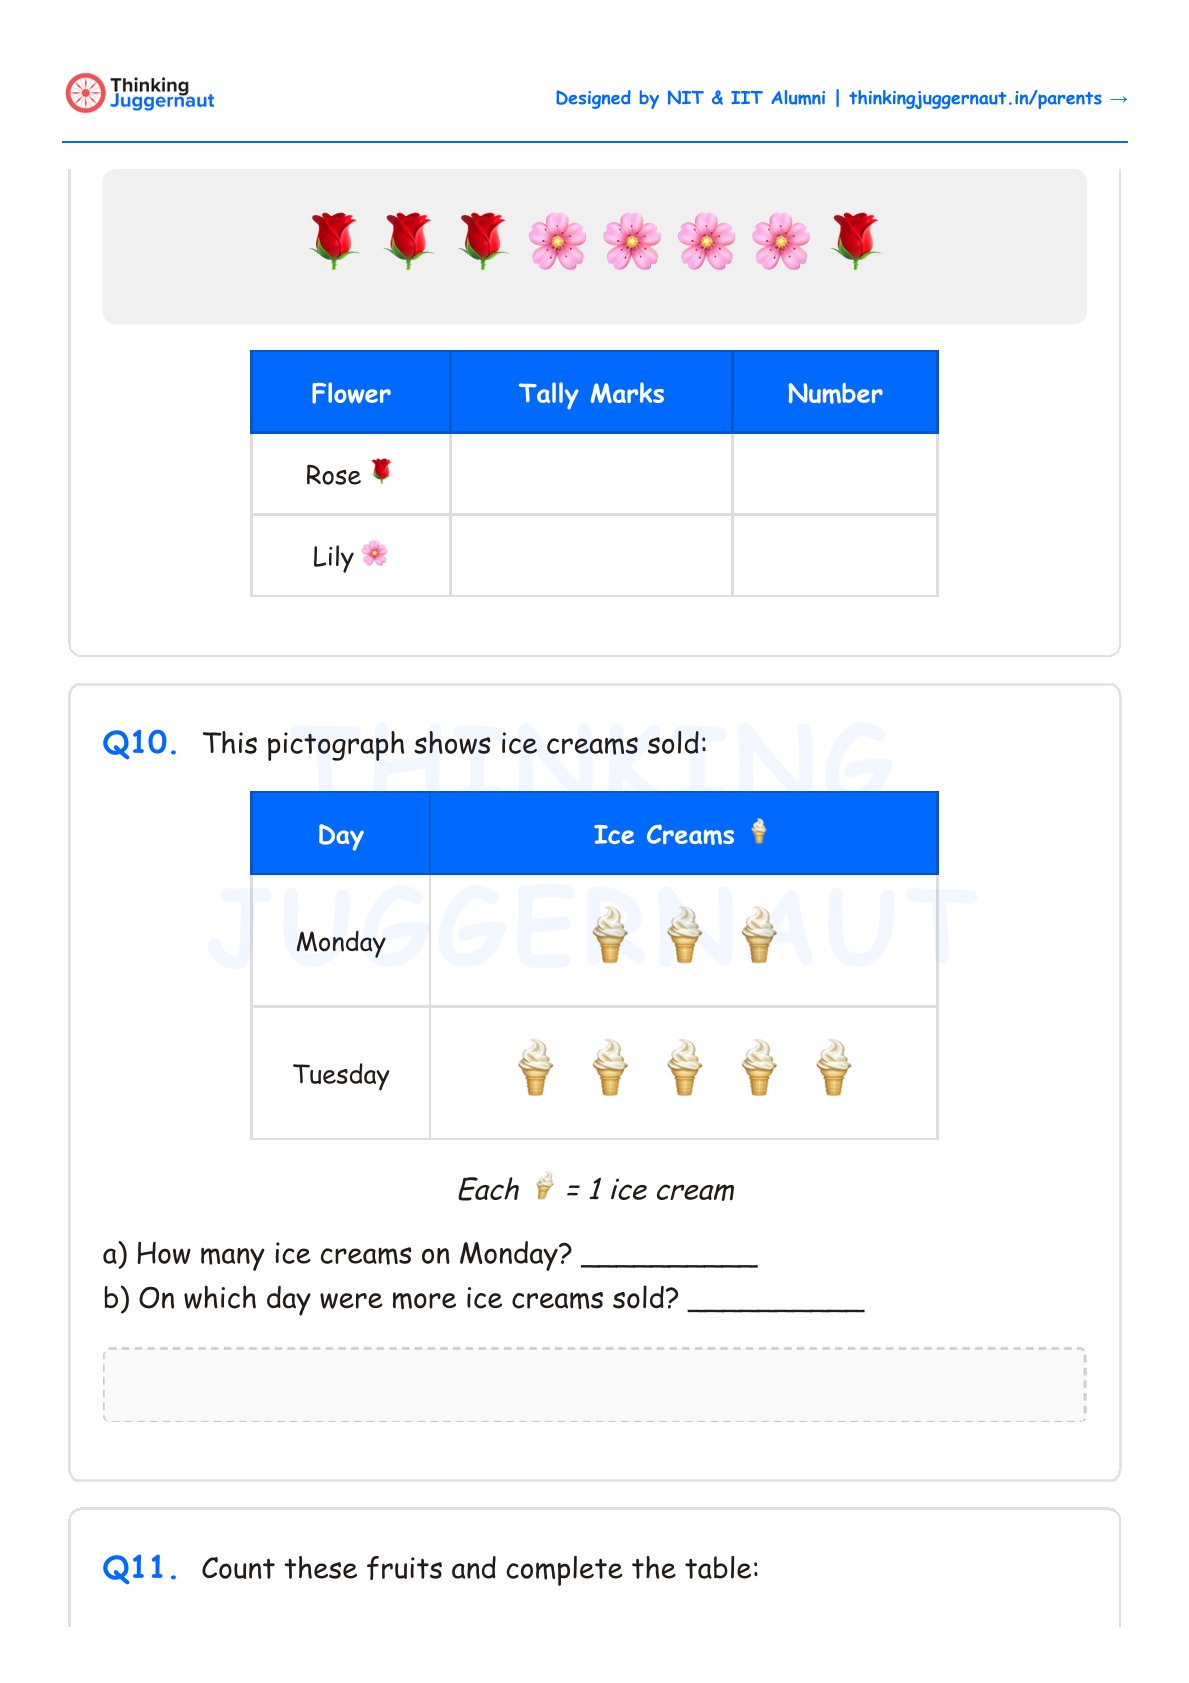
Pictographs: Pictures or symbols used to represent data. In Class 4, each picture stands for exactly 1 item, making them straightforward to read and draw.
Tables: Information organised neatly into rows and columns so we can read it at a glance.
A pictograph shows toys in a shop. Cars have 5 symbols and Balls have 3 symbols. Each symbol represents 1 toy.
Count the number of symbols next to each item. Cars have 5 symbols, so there are 5 cars. Balls have 3 symbols, so there are 3 balls. Cars have more toys than balls.
Remember that a crossed group of tally marks equals 5, not 4. This is the most common mistake at this stage.
Count slowly and carefully. Rushing leads to missed items, especially when sorting mixed objects.
Always check every symbol in a pictograph before writing your answer. Missing even one changes the total.
Practice daily by counting real things around you — toys, books, pencils — and recording them using tally marks.
Write your answers clearly. Skipping the final step of writing down the number is an easy mark to lose.
Class 4 Division
Class 4 Division Word Problems
Class 4 Perimeter and Area
Class 4 Decimals
Class 4 Data Handling
Class 4 Factors and Multiples
Class 4 Fractions
Class 4 Geometry
Class 4 Word Problems
Not in Class 4?
Visit our Main Math Worksheet Hub to explore all printable worksheets from Class 2 to Class 8.