
Learn data handling for Class 2 with tally marks, pictographs, and bar graphs. Includes solved examples, practice questions, and tips to help your child collect and organise data with ease.
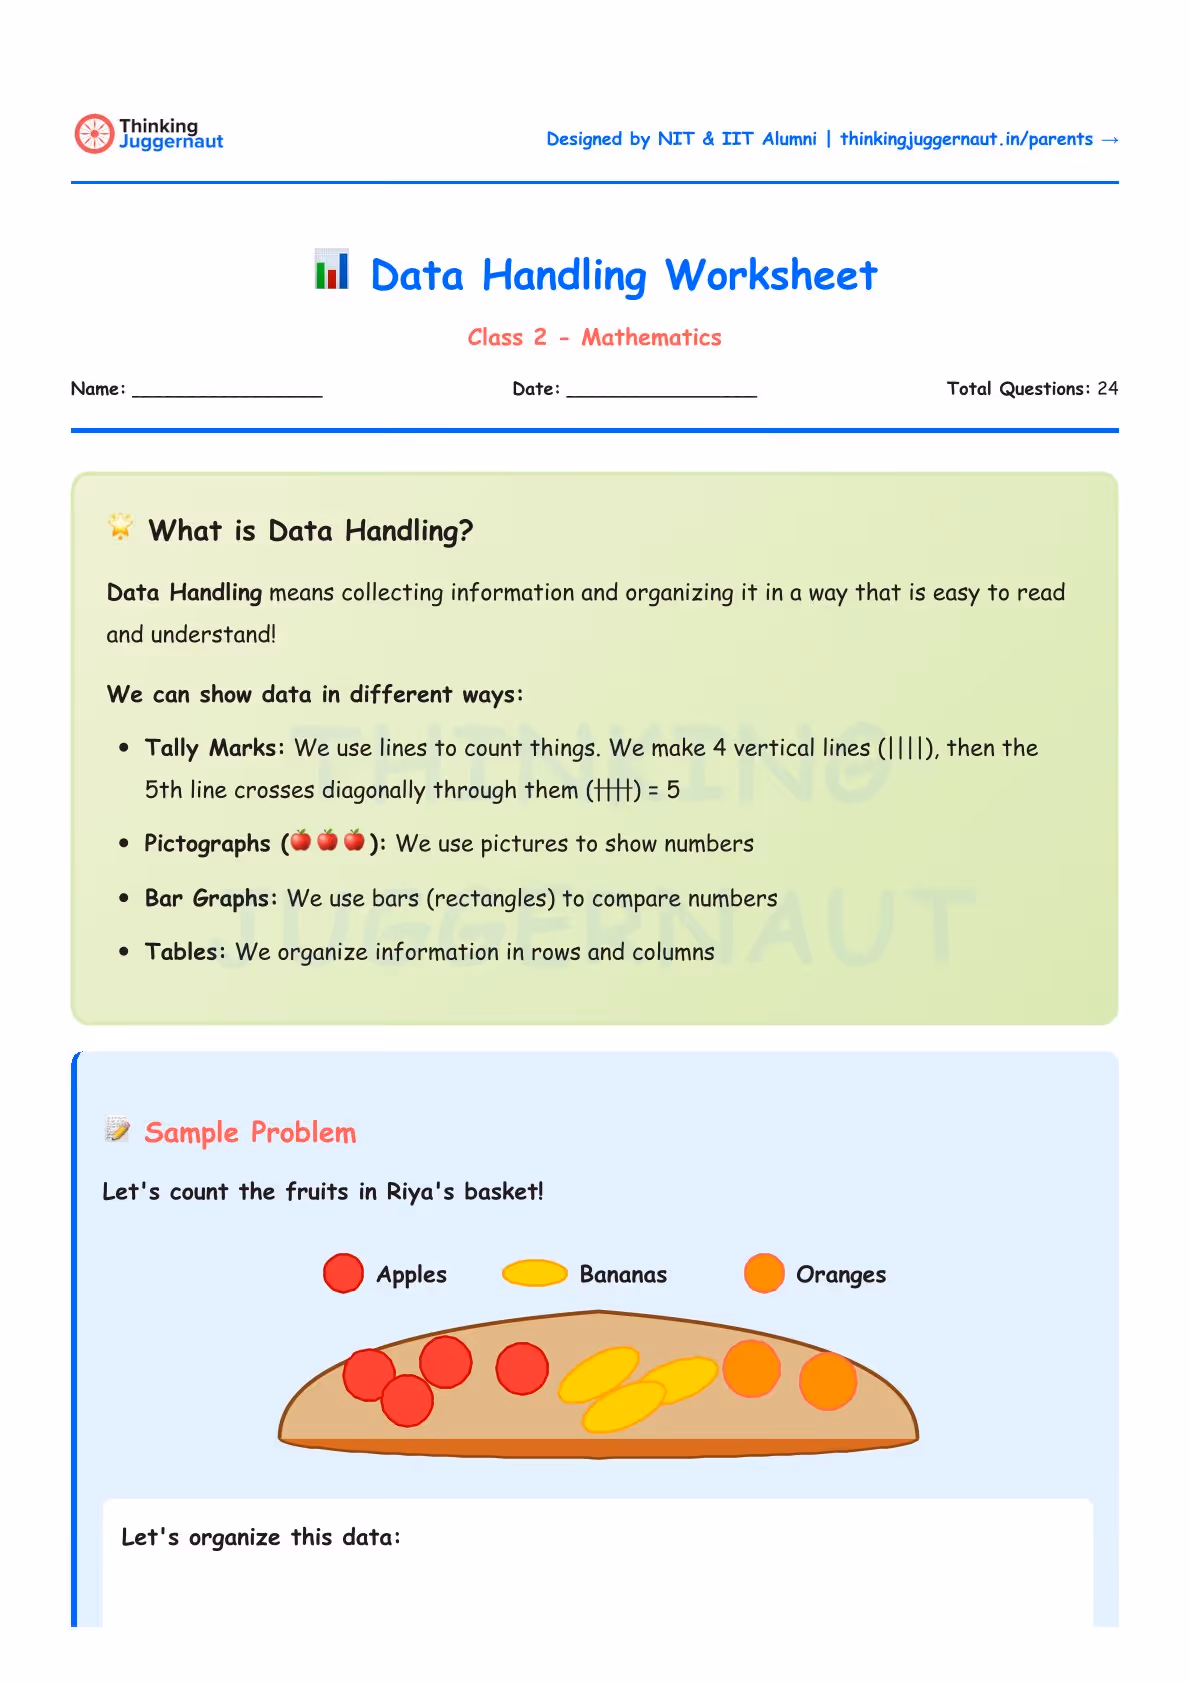
Data Handling means collecting information and organising it in a way that is easy to read and understand. We can show data in different ways.
Tally Marks: We use lines to count things. We make 4 vertical lines, then the 5th line crosses diagonally through them to make a group of 5.
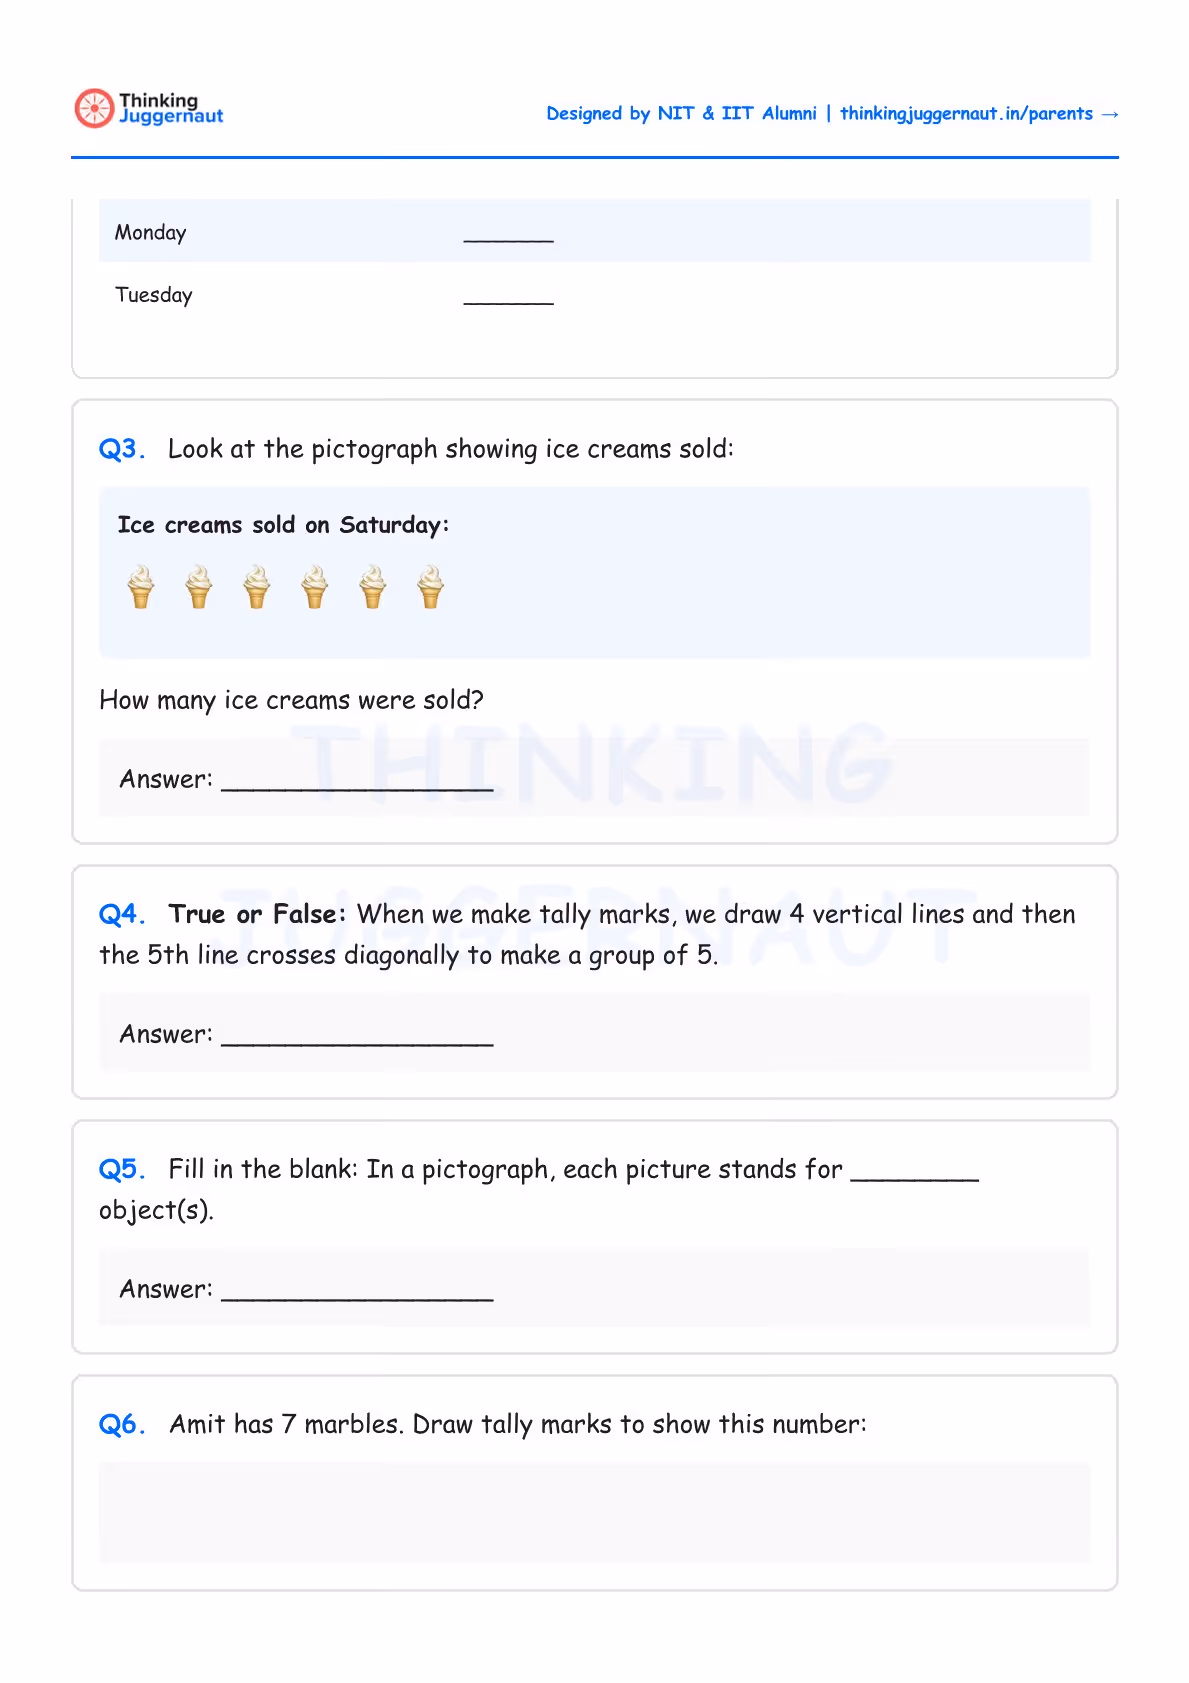
Pictographs: We use pictures to show numbers.
Bar Graphs: We use bars (rectangles) to compare numbers.
Tables: We organise information in rows and columns.
Riya has a basket of fruits – 4 apples, 3 bananas, and 2 oranges. We organise this into a table and answer questions.
How many apples? Answer: 4 apples.
Which fruit has the most? Answer: Apples.
How many fruits in total? Answer: 4 + 3 + 2 = 9 fruits.
Practice tally marks daily – Count objects around you using tally marks. Every group of 5 is 4 vertical lines with 1 diagonal line crossing them.
Create your own surveys – Ask 10 friends about their favourite fruit, colour, or game.
Read tables carefully – Look at both rows and columns to find the information you need.
Real-life data collection – Count vehicles passing by, birds in the park, or books on your shelf.
Learn to compare – Practice finding "most," "least," "more than," and "less than."
Draw pictures – Convert numbers into pictures and pictures into numbers to make learning fun.
Worksheets build practice. The Applied Maths Project Kit builds understanding — 30 real-world math activities covering the same concepts your child is practising here, from multiplication and grouping to measurement and data.
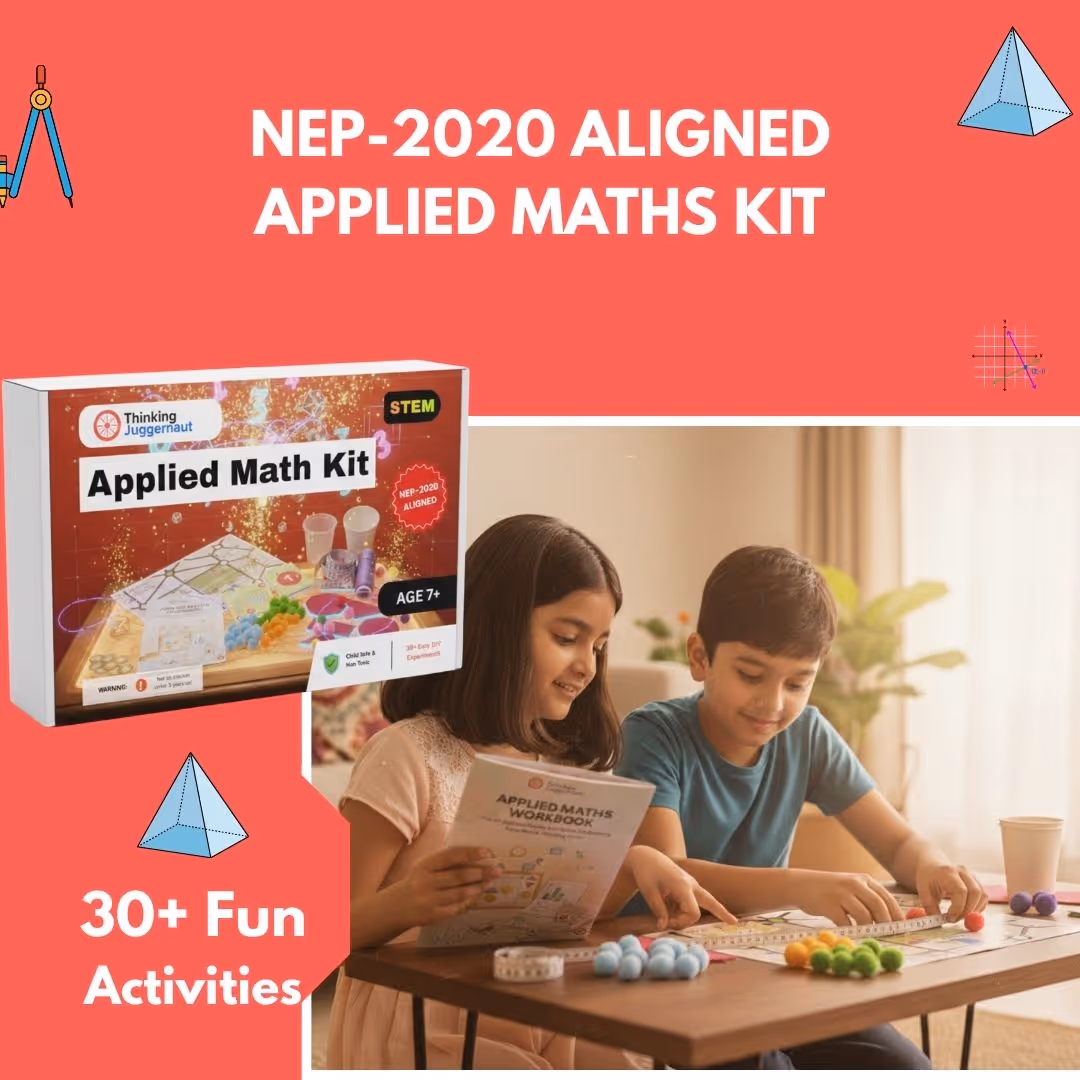
Designed by IIT & NIT Alumni · NEP-2020 aligned · Trusted by parents across India
Class 2 Addition and Subtraction
Class 2 Addition and Subtraction Word Problems
Class 2 Data Handling
Class 2 Multiplication
Class 2 Place Value
Class 2 Shapes
Not in Class 2?
Visit our Main Math Worksheet Hub to explore all printable worksheets from Class 2 to Class 8.
Almost there!
We will confirm your order on WhatsApp
Order placed!
Thank you! You will receive a WhatsApp confirmation shortly.