Every time your child spots the most popular flavour at a birthday party or figures out which team scored the most runs — they're doing data handling. This free Class 4 worksheet builds that natural curiosity into a real skill: collecting data, organising it with tally marks, reading pictographs and tables, and drawing conclusions.
Data means information or numbers that we collect about the world around us. Data Handling is the process of organising this information so it becomes easy to count, compare, and understand.
Tally Marks: A quick way to count things. We draw 4 vertical lines and cross them with a 5th diagonal line to make a group of 5. This makes counting large numbers faster and less error-prone.
Pictographs: Pictures or symbols used to represent data. In Class 4, each picture stands for exactly 1 item, making them straightforward to read and draw.
Tables: Information organised neatly into rows and columns so we can read it at a glance.
A pictograph shows toys in a shop. Cars have 5 symbols and Balls have 3 symbols. Each symbol represents 1 toy.
Count the number of symbols next to each item. Cars have 5 symbols, so there are 5 cars. Balls have 3 symbols, so there are 3 balls. Cars have more toys than balls.
Remember that a crossed group of tally marks equals 5, not 4. This is the most common mistake at this stage.
Count slowly and carefully. Rushing leads to missed items, especially when sorting mixed objects.
Always check every symbol in a pictograph before writing your answer. Missing even one changes the total.
Practice daily by counting real things around you — toys, books, pencils — and recording them using tally marks.
Write your answers clearly. Skipping the final step of writing down the number is an easy mark to lose.
This worksheet covers:
Download Class 4 data handling Worksheet here
What topics are covered in Class 4 Data Handling?
Class 4 Data Handling covers tally marks, pictographs, tables, bar graphs, and basic data interpretation — reading, organising, and comparing data.
What is the difference between a pictograph and a bar graph?
A pictograph uses symbols or pictures to show data. A bar graph uses rectangular bars. Bar graphs are easier to use when values are large or need a scale.
How do I teach tally marks to a Class 4 child at home?
Start with real objects — ask your child to count their books, pencils, or toys and record each one as a tally mark. Group them into fives and count the total.
Is data handling in the CBSE Class 4 syllabus?
Yes. Data handling is part of the CBSE and NCERT Class 4 Mathematics syllabus under the topic of measurement and data.
What comes after data handling in Class 5?
In Class 5 and 6, students work with larger datasets, double bar graphs, and are introduced to mean, median, and mode.
Worksheets build practice. The Applied Maths Project Kit builds understanding — 30 real-world math activities covering the same concepts your child is practising here, from multiplication and grouping to measurement and data.
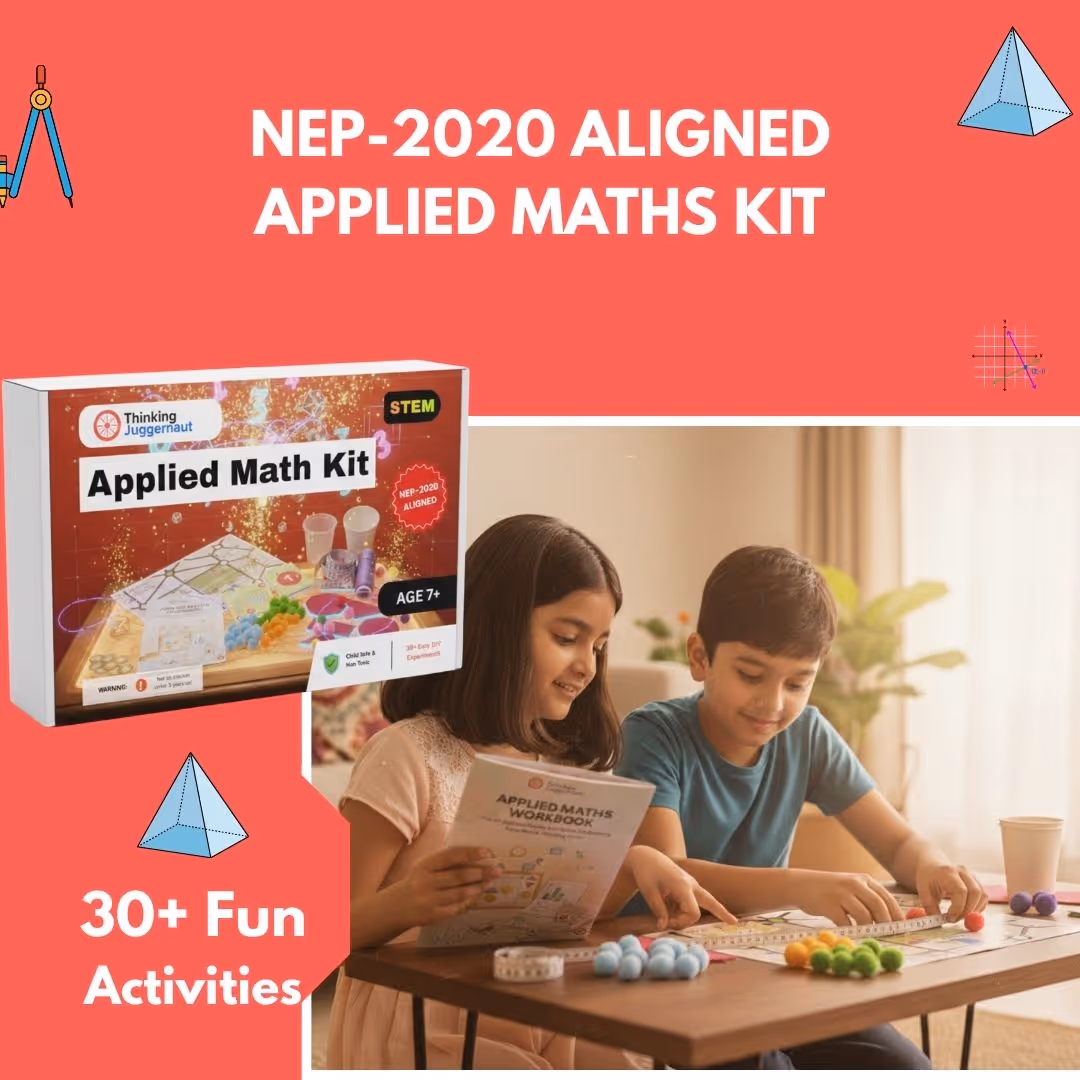
Designed by IIT & NIT Alumni · NEP-2020 aligned · Trusted by parents across India
Not in Class 4?
Visit our Main Math Worksheet Hub to explore all printable worksheets from Class 2 to Class 8.
Almost there!
We will confirm your order on WhatsApp
Order placed!
Thank you! You will receive a WhatsApp confirmation shortly.