Project-Based Learning Activities: Interdisciplinary STEM Projects for Indian Classrooms

NEP 2020 emphasizes hands-on, interdisciplinary learning. We see the value. But between managing resources, coordinating teachers, and ensuring learning outcomes—implementation feels overwhelming.

This guide shares ready-to-implement project ideas and shows exactly how subjects connect through hands-on activities.

Three children conducting a science experiment with a toy car rolling down a wooden ramp supported by books, using a stopwatch and measuring tape in a classroom.

"We want to try project-based learning, but where do we start?"

Every school asks this. We know NEP 2020 emphasizes hands-on, interdisciplinary learning. We see the value. But between managing resources, coordinating teachers, and ensuring learning outcomes—implementation feels overwhelming.

This guide shares ready-to-implement project ideas and shows exactly how subjects connect through hands-on activities.

Skip directly to Ready-to-Use STEM Projects Class Wise. For Real World Math Activities refer here.

What is Project Based Learning?

Project-based learning means students learn by doing, not just listening. They tackle real problems, test solutions, analyze results, and present findings—connecting multiple subjects naturally while developing critical thinking and problem-solving skills.

The best STEM project based learning activities for kids don't need expensive labs or complicated prep. They need good design, clear learning goals, and the right materials.

This guide shares ready-to-implement project ideas and shows exactly how subjects connect through hands-on activities.

Interdisciplinary STEM Learning

Science class teaches photosynthesis. Geography class teaches climates in different zones. Math class teaches data handling and graphs.

Knowledge? Yes. But, fragmented.

Students struggle to apply these concepts across contexts. Students don't connect the dots

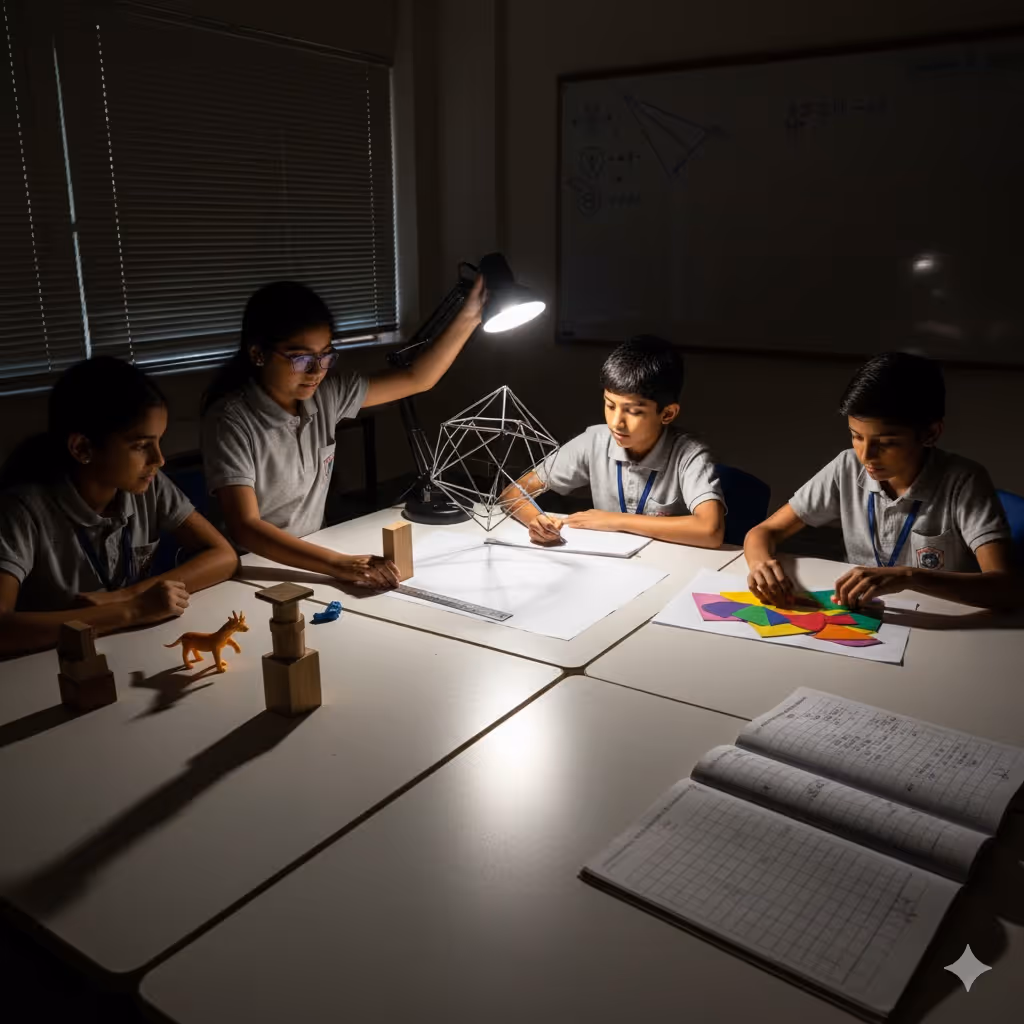
Real interdisciplinary learning means subjects naturally merge because the problem demands it.

Students investigate one question: "Why is our area getting hotter each summer?"

  • Science: Study heat, greenhouse effect, urban heat islands
  • Geography: Map green cover changes over 10 years
  • Math: Analyze temperature data, create trend graphs
  • Social Studies: Research urbanization patterns, policy impacts
  • Language: Interview residents, document findings
  • Art: Create awareness visuals

Result: Connected understanding. Students see how knowledge from different domains solves real problems together.

Person sitting cross-legged at a desk with a globe and tablet displaying charts, connected to icons of science, math, technology, art, and geography illustrating interdisciplinary learning.

It need not be so many subjects as well, even connecting two concepts from math and science works wonders.

You can skip to the next section on class wise interdisciplinary STEM Projects if you want to explore different projects that you can try in classroom or here

How to Make Project-Based Learning Work

The Zero-Prep Solution

The biggest barrier? Time and resources.

Teachers tell us: "We don't have time to source materials, design experiments, and coordinate between subjects."

That's exactly why we created Thinking Juggernaut's Interdisciplinary STEM Kit.

What you get:

  • 30+ ready-to-use experiments covering Physics, Chemistry, Biology, Math, Engineering
  • All materials included
  • Clear learning objectives linked to curriculum
  • Experiments designed to connect multiple subjects naturally

Zero prep. Maximum learning.

While this is for parents, we have a class-wise solution for schools.

Want to bring project-based learning to your school without the planning headache? Contact us to discuss how our kits can work for your students.

Four students in gray uniforms seated around a table in a dim room, engaged in a STEM activity illuminated by a desk lamp, with geometric models and notebooks.

Ready-to-Use STEM Projects Class Wise

STEM PROJECT 1: School Garden Investigation (Class 6-8)

Duration: 4-6 weeks

The Question: What conditions help plants grow best in our school?

How subjects connect:

Science:

  • Test soil pH, moisture, composition
  • Observe photosynthesis effects (sunlight vs shade)
  • Study plant biology, ecosystems
  • Track growth rates

Math:

  • Measure plot dimensions, calculate area
  • Record growth data weekly
  • Create graphs comparing different conditions
  • Calculate resource needs (water, fertilizer quantities)

Geography:

  • Study local climate, rainfall patterns
  • Understand native vs non-native plants
  • Map sun/shade areas in school

Language:

  • Research best practices for local plants
  • Document the entire process
  • Create garden care guides
  • Interview local gardeners

Social Studies:

  • Study sustainable agriculture
  • Research food security
  • Understand community gardens

What students do:

  1. Test different soil types in different areas
  2. Plant same seeds in varying conditions
  3. Measure and record growth weekly
  4. Analyze which conditions worked best
  5. Present findings with data visualization
  6. Propose school garden design based on evidence

Assessment: Did they collect reliable data? Can they explain why certain conditions worked? Can they design a garden for a different location using their learning?

Natural fit: Thinking Juggernaut's Interdisciplinary STEM Kit includes soil testing and plant growth experiments that support this exact project.

PROJECT 2: Energy Audit Challenge (Class 7-10)

Duration: 3-4 weeks

The Question: How much energy does our school use, and how can we reduce it?

How subjects connect:

Science:

  • Understand electricity, power consumption, circuits
  • Study renewable vs non-renewable energy
  • Learn energy conversion, efficiency

Math:

  • Calculate kWh usage from appliance wattage
  • Analyze monthly electricity bills
  • Create cost projections
  • Calculate ROI for energy-saving measures
  • Data visualization (pie charts, bar graphs)

Social Studies:

  • Research climate change impacts
  • Study sustainable development
  • Understand energy policy

Economics:

  • Cost-benefit analysis of LED vs regular bulbs
  • Calculate payback period for solar panels
  • Budget planning for improvements

Language:

  • Write recommendations report
  • Present to school management
  • Create awareness posters

What students do:

  1. List all electrical devices in school
  2. Note wattage and daily usage hours
  3. Calculate daily and monthly consumption
  4. Research current electricity rates
  5. Calculate monthly cost
  6. Identify biggest energy users
  7. Research alternatives (LED lights, solar, timers)
  8. Calculate savings from each change
  9. Present proposal with data

Real outcome: Some schools have actually implemented student recommendations, reducing bills by 20-30%.
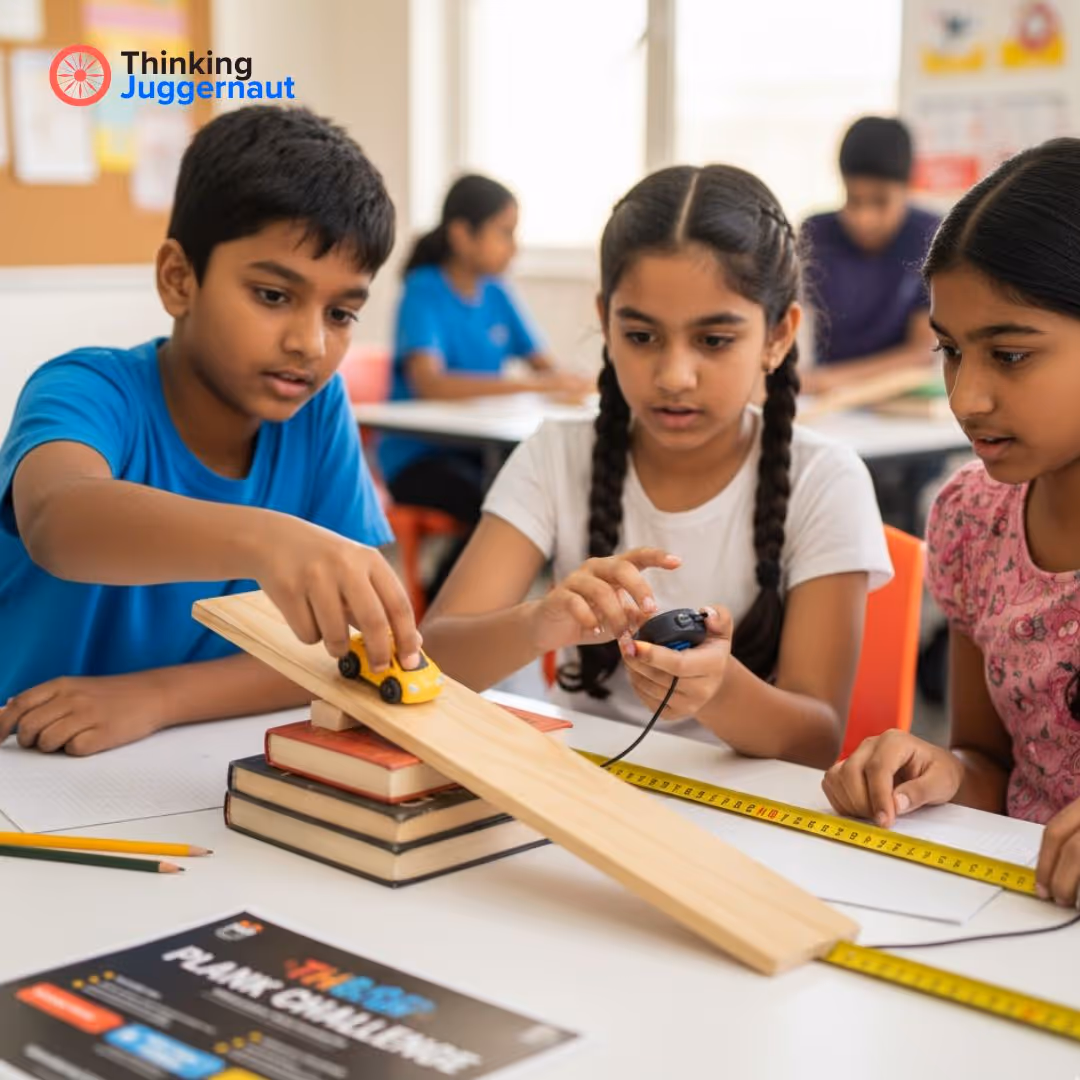
PROJECT 3: Motion and Speed Investigation (Class 6-9)

Young boy in blue shirt playing with a ramp made of wooden board and books, rolling a toy car down while holding a yellow stopwatch.

Duration: 2-3 weeks

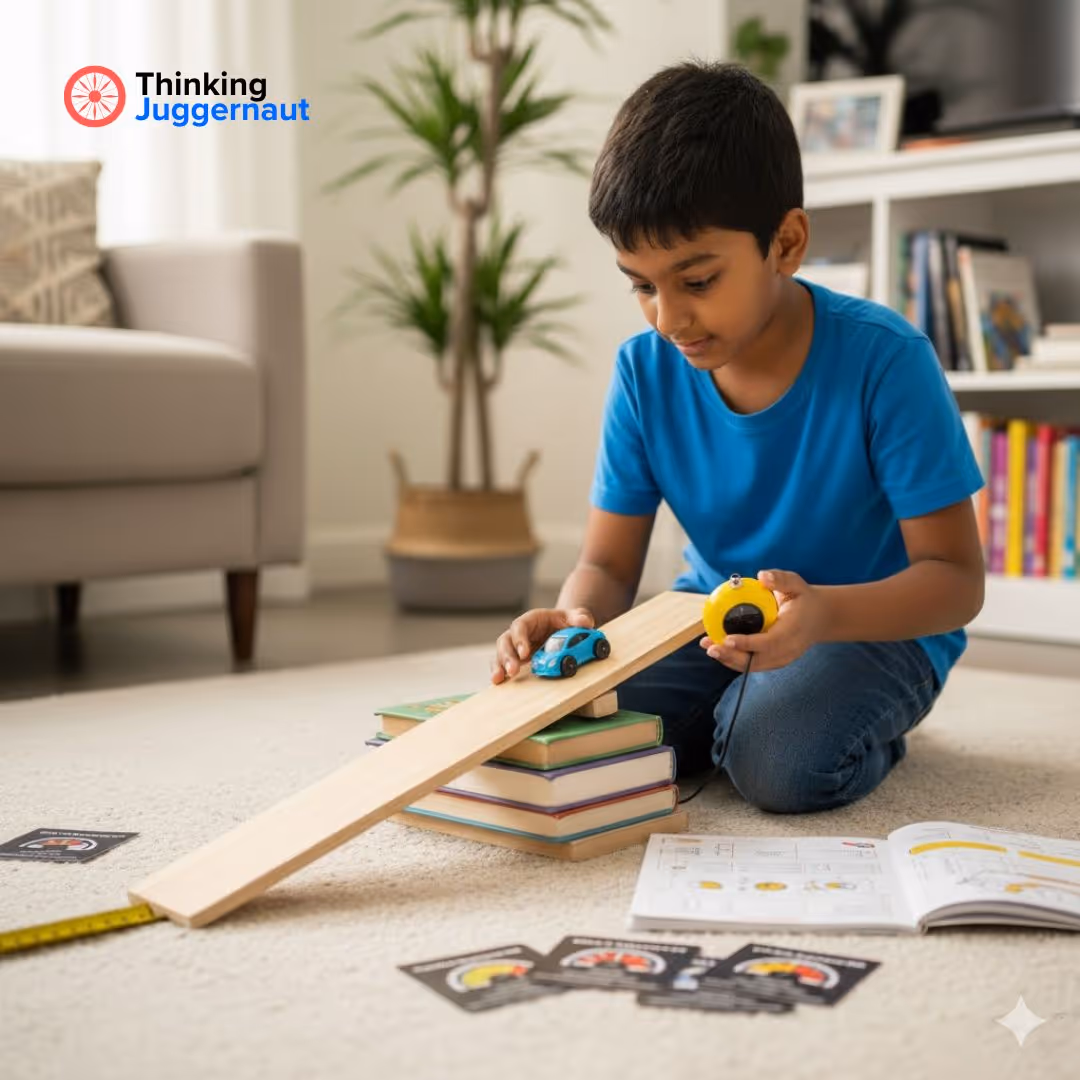
The Question: How does slope affect the speed of moving objects?

How subjects connect:

Physics:

  • Study speed, distance, time relationships
  • Understand potential and kinetic energy
  • Learn about friction, forces
  • Explore energy conversion

Math:

  • Calculate speed = distance ÷ time
  • Convert units (cm/sec to km/hr)
  • Calculate averages from multiple trials
  • Measure angles using protractors
  • Plot graphs (height vs speed)
  • Identify linear relationships

Engineering:

  • Design ramps at different angles
  • Test variables systematically
  • Optimize for specific outcomes
  • Create brake zones for safety

Real-world application:

What students do:

  1. Build ramps at different heights (2, 4, 6 books)
  2. Release toy car from top, time until it stops
  3. Measure total distance traveled
  4. Calculate speed for each height
  5. Measure ramp angles
  6. Test different surfaces (smooth wood vs cloth) for friction
  7. Create brake zones with paper strips
  8. Repeat trials, calculate averages
  9. Plot height vs speed graphs
  10. Predict what happens if height doubles
  11. Test prediction, explain results

What they discover:

  • Speed doesn't double when height doubles (it increases by √2)
  • Friction significantly affects results
  • Multiple trials give more reliable data
  • Patterns emerge when data is graphed

Assessment: Can they predict speed for a new height? Can they explain why doubling height doesn't double speed? Can they design a safe ramp for a specific speed limit?

Our Interdisciplinary STEM Kit includes the complete ramp, toy car, and measuring tools for this experiment. Students don't just read about physics—they test, measure, and discover the relationships themselves.

PROJECT 4: Community Water Story (Class 8-10)

Duration: 4 weeks

The Question: Where does our water come from, and is it being used sustainably?

How subjects connect:

Geography:

  • Map local water sources
  • Study watershed, groundwater levels
  • Understand water table changes

Science:

  • Water cycle, filtration, purification
  • Test water quality (pH, hardness)
  • Study water contamination

Math:

  • Calculate per capita water usage
  • Analyze consumption trends over years
  • Project future needs based on population growth
  • Compare usage: residential vs industrial

Social Studies:

  • Water rights, access inequalities
  • Government policies on water conservation
  • Community conflicts over water

Economics:

  • Cost of water supply
  • Economic impact of water scarcity
  • Pricing policies

Language:

  • Interview municipal officials, residents
  • Document oral histories about water availability
  • Write investigative report

What students do:

  1. Research water source for their area
  2. Collect historical data on water availability
  3. Interview 20+ people about water usage changes
  4. Test water samples if possible
  5. Calculate household and school water usage
  6. Map water infrastructure in locality
  7. Analyze data for trends
  8. Create recommendations
  9. Present to community

PROJECT 5: Local Market Economics (Class 6-9)

Illustration of a young makers' market stall with three kids selling crafts like soap, plants, books, jewelry, and a yellow t-shirt, with a boy pointing at the stall and a wooden chest filled with coins and paper money.

Duration: 3-4 weeks

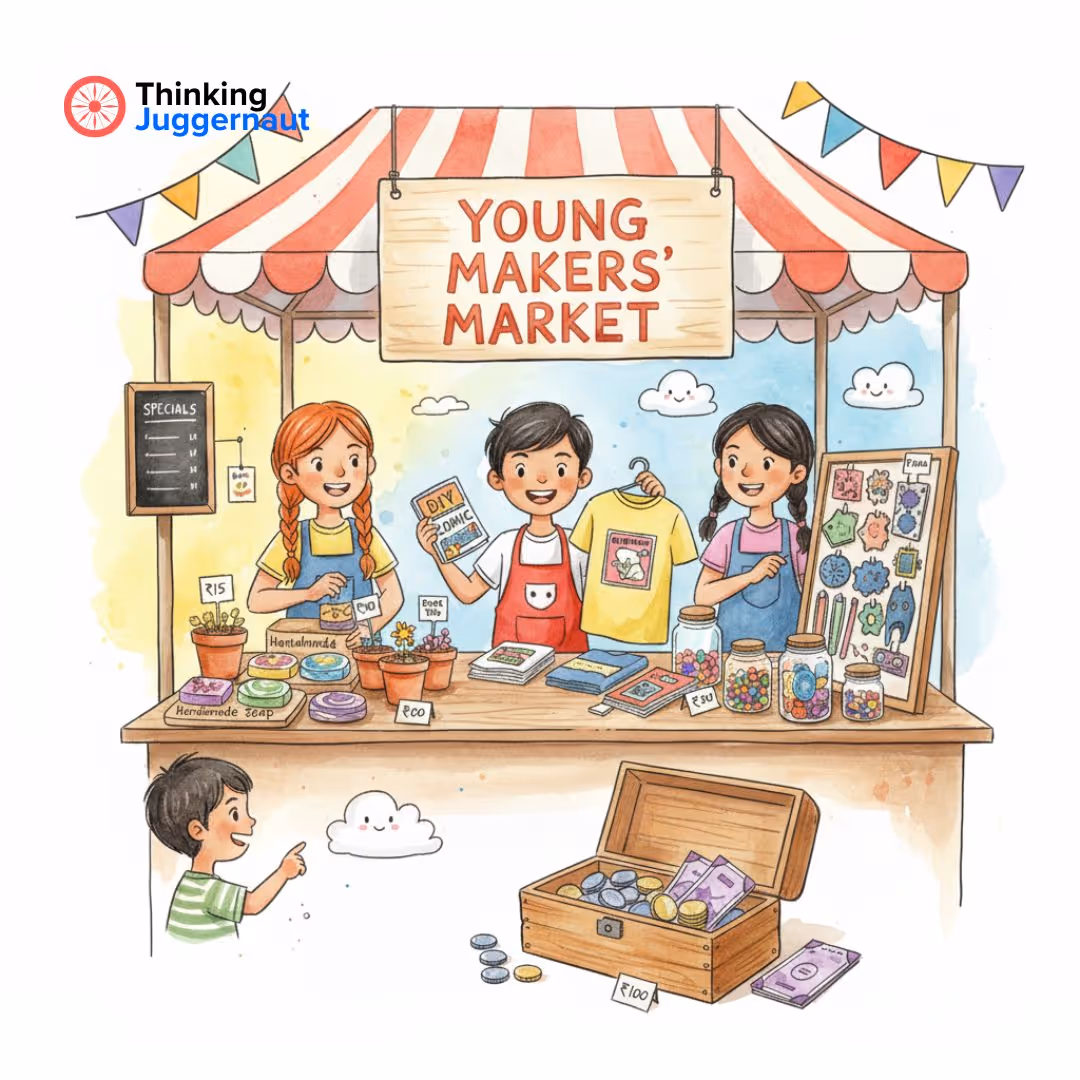
The Question: How do prices change in our local market, and why?

How subjects connect:

Economics:

  • Supply and demand basics
  • Price fluctuation factors
  • Market competition

Math:

  • Track prices over 4 weeks
  • Calculate percentage changes
  • Create price comparison charts
  • Find averages, identify patterns

Geography:

  • Where do products come from?
  • How does distance affect price?
  • Seasonal availability

Social Studies:

  • Consumer behavior
  • Fair trade practices
  • Impact of festivals on demand

Language:

  • Interview vegetable vendors, shopkeepers
  • Document stories
  • Create market guide

What students do:

  1. Choose 10 common items (vegetables, rice, etc.)
  2. Record prices weekly from 3 different vendors
  3. Note any special events (festivals, holidays)
  4. Interview vendors about price changes
  5. Research where items come from
  6. Analyze data: what changed most? why?
  7. Predict next week's prices
  8. Test predictions
  9. Present findings

If starting with 5-6 subjects is overwhelming, start with 2-3 that naturally connect. Science + Math works easily. Expand gradually.

Why STEM Activities Matter?

Research from Buck Institute for Education shows that students in project-based learning environments demonstrate:

  • 20-30% better retention compared to traditional instruction
  • Improved critical thinking and problem-solving skills
  • Higher engagement, especially for students who struggle with traditional methods

The shift towards project-led education is already gaining momentum in India.

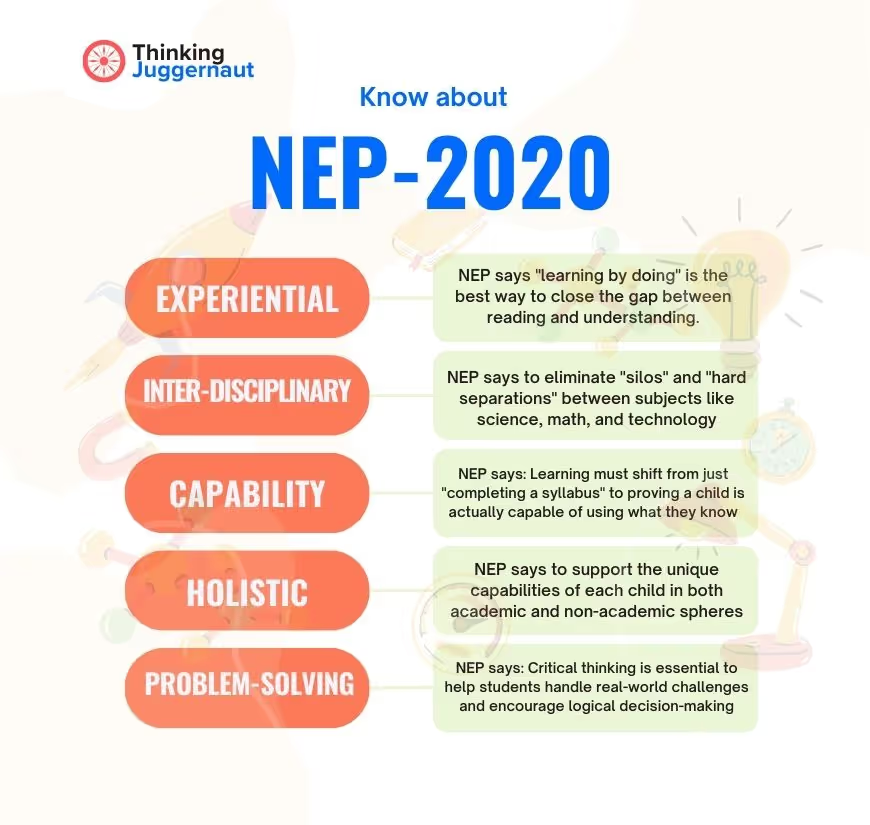
NEP 2020 specifically emphasizes experiential learning and breaking down subject silos—recognizing that real-world problems don't come in neat subject boxes.

CBSE has introduced competency-based assessment frameworks that evaluate understanding and application, not just memorization. This shift makes hands-on STEM activities essential, not optional.

FAQ

This sounds time-consuming. How do we manage the syllabus?

Pick topics that overlap naturally. Example: Energy (in science syllabus) + Data analysis (in math) + Climate change (in social studies). One project covers multiple syllabus points simultaneously. You're not adding work—you're reorganizing it.

Want to bring project-based learning to your school without the planning headache? Contact us to discuss how our kits can work for your students.

What if students struggle to connect subjects themselves?

Start with guided questions: "What data do we need?" (Math), "How does this process work scientifically?" (Science), "Who is affected by this?" (Social Studies). With practice, they'll start seeing connections naturally.

How do we assess if different teachers have different standards?

Use a common rubric all teachers agree on: Research quality (0-5), Data accuracy (0-5), Connection between subjects (0-5), Presentation (0-5). Each teacher grades their domain, everyone discusses integration quality together.

Won't this only work for "bright" students?

No—often students who struggle with pure theory excel in applied projects. When learning is hands-on and purposeful, different strengths emerge. Struggling math students often shine when math is used to solve real problems they care about.

Related Articles